Solutions
 KM#6: Location of the Epicenter of an Earthquake (Level 2)
Mathematical Content: Basic algebra; equation of a line; radius of a circle
Solutions: KM #6 Finding the Epicenter of an Earthquake
Step 1: Write an equation that shows how far each type of wave traveled after t seconds?


Step 2:
A) Solve each of the two e quations from Step 1 for times, ts and tp. Since the distance is the same for each wave, denote this by D (= dp = ds).
 ,
, 
B) Take the difference of the results from Part A; be sure your answer is positive. Denote this difference by the variable U.

C) What does your answer to Part B represent?
Difference in arrival times for P- and S-waves
D) Solve the equation from Part B for distance D.

Step 3:
A) From the data given in the table above, compute the time differences in seconds that P and S waves were received at the stations. Complete the column for U in the table.
B) Use your answers to Part A and the equation from Step 2B to find the distances from the stations to the epicenter of the earthquake to fill in the column for D.
| Station | Longitude |
Latitude |
Arrival Time |
Arrival Time |
Time Diff (U) |
Dist to Epicenter (D) |
Scaled Distance for Map |
1. TUC |
32.3097N |
110.7842W |
3:31:25 |
3:31:54 |
30 |
252 |
2.45 |
2. ANMO |
34.9502N |
106.4602W |
3:31:28 |
3:32:00 |
32 |
269 |
2.62 |
3. GDL2 |
32.2003N |
104.3635W |
3:31:45 |
3:32:29 |
44 |
370 |
3.6 |
4. LTX |
29.3339N |
103.6669W |
3:32:22 |
3:33:32 |
70 |
588 |
5.72 |
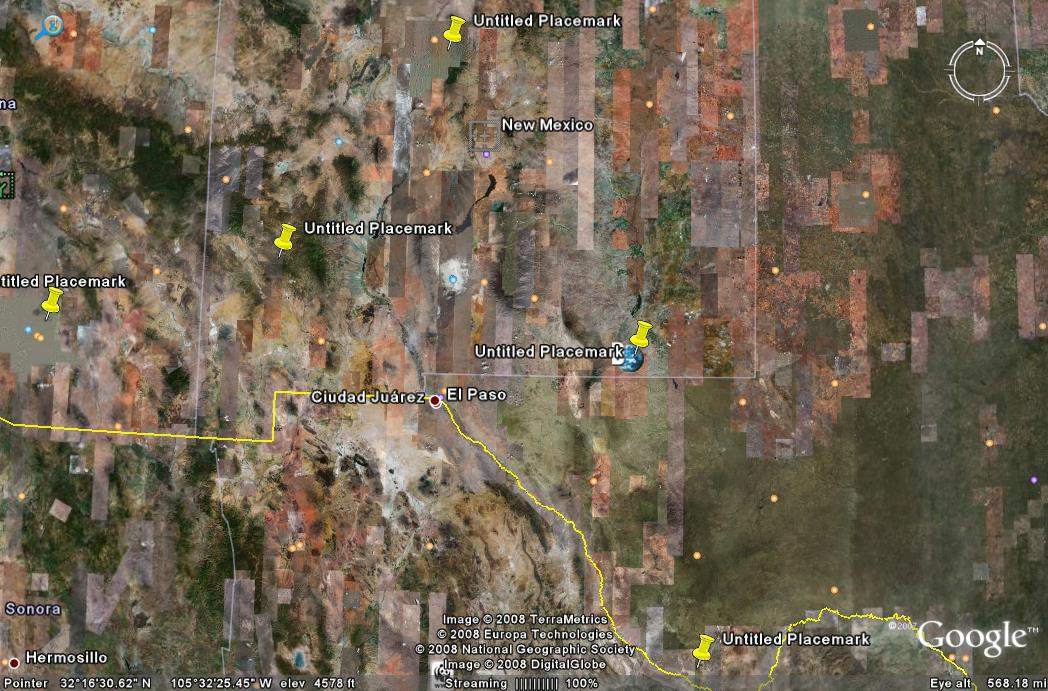
Step 4. See map shown
Step 5. Next, you will need to figure out the scale on the map.
- Measure, in inches, the east-west distance on the map along the southern border of New Mexico from Texas to Arizona.
**On the Google map printed from my computer, the distance across the southern border of New Mexico is 5.5 inches. Note: this may vary with printing from different computers.
- Now use this information to figure the scale for this map in km/inch. The real distance between these locations is 565.56 kilometers (Google Earth).
The scale is  .
.
Step 6.
A) Convert the distances D to fit the scale on the map; fill in the last column, Scaled Distance for Map, in the table with these data.
This is the right hand column in the Table above. For Station 1, Scaled distance =
 .
.
B) and C) Use the distances you computed in the table for U and the scale for the map to draw a circle with center at each station and radius the scaled distance from that station to the epicenter. Look at these circles and locate the epicenter.
Draw Circles with centers at Stations and radii shown in the table.
D) What are the coordinates of the epicenter? What city or town is it near?
Epicenter at 33.00N, 108.23W – just north of Silver City (See map)